

RooCon
Biological Network Analysis and Interactive Result Sharing.
RooCon is a network analysis tool for visualizing and statistically analyzing experimental data on user-defined biological networks.
Create your own biological network, overlay quantitative experimental data, perform statistical comparisons, explore network-level changes, and share interactive results with collaborators.
Contact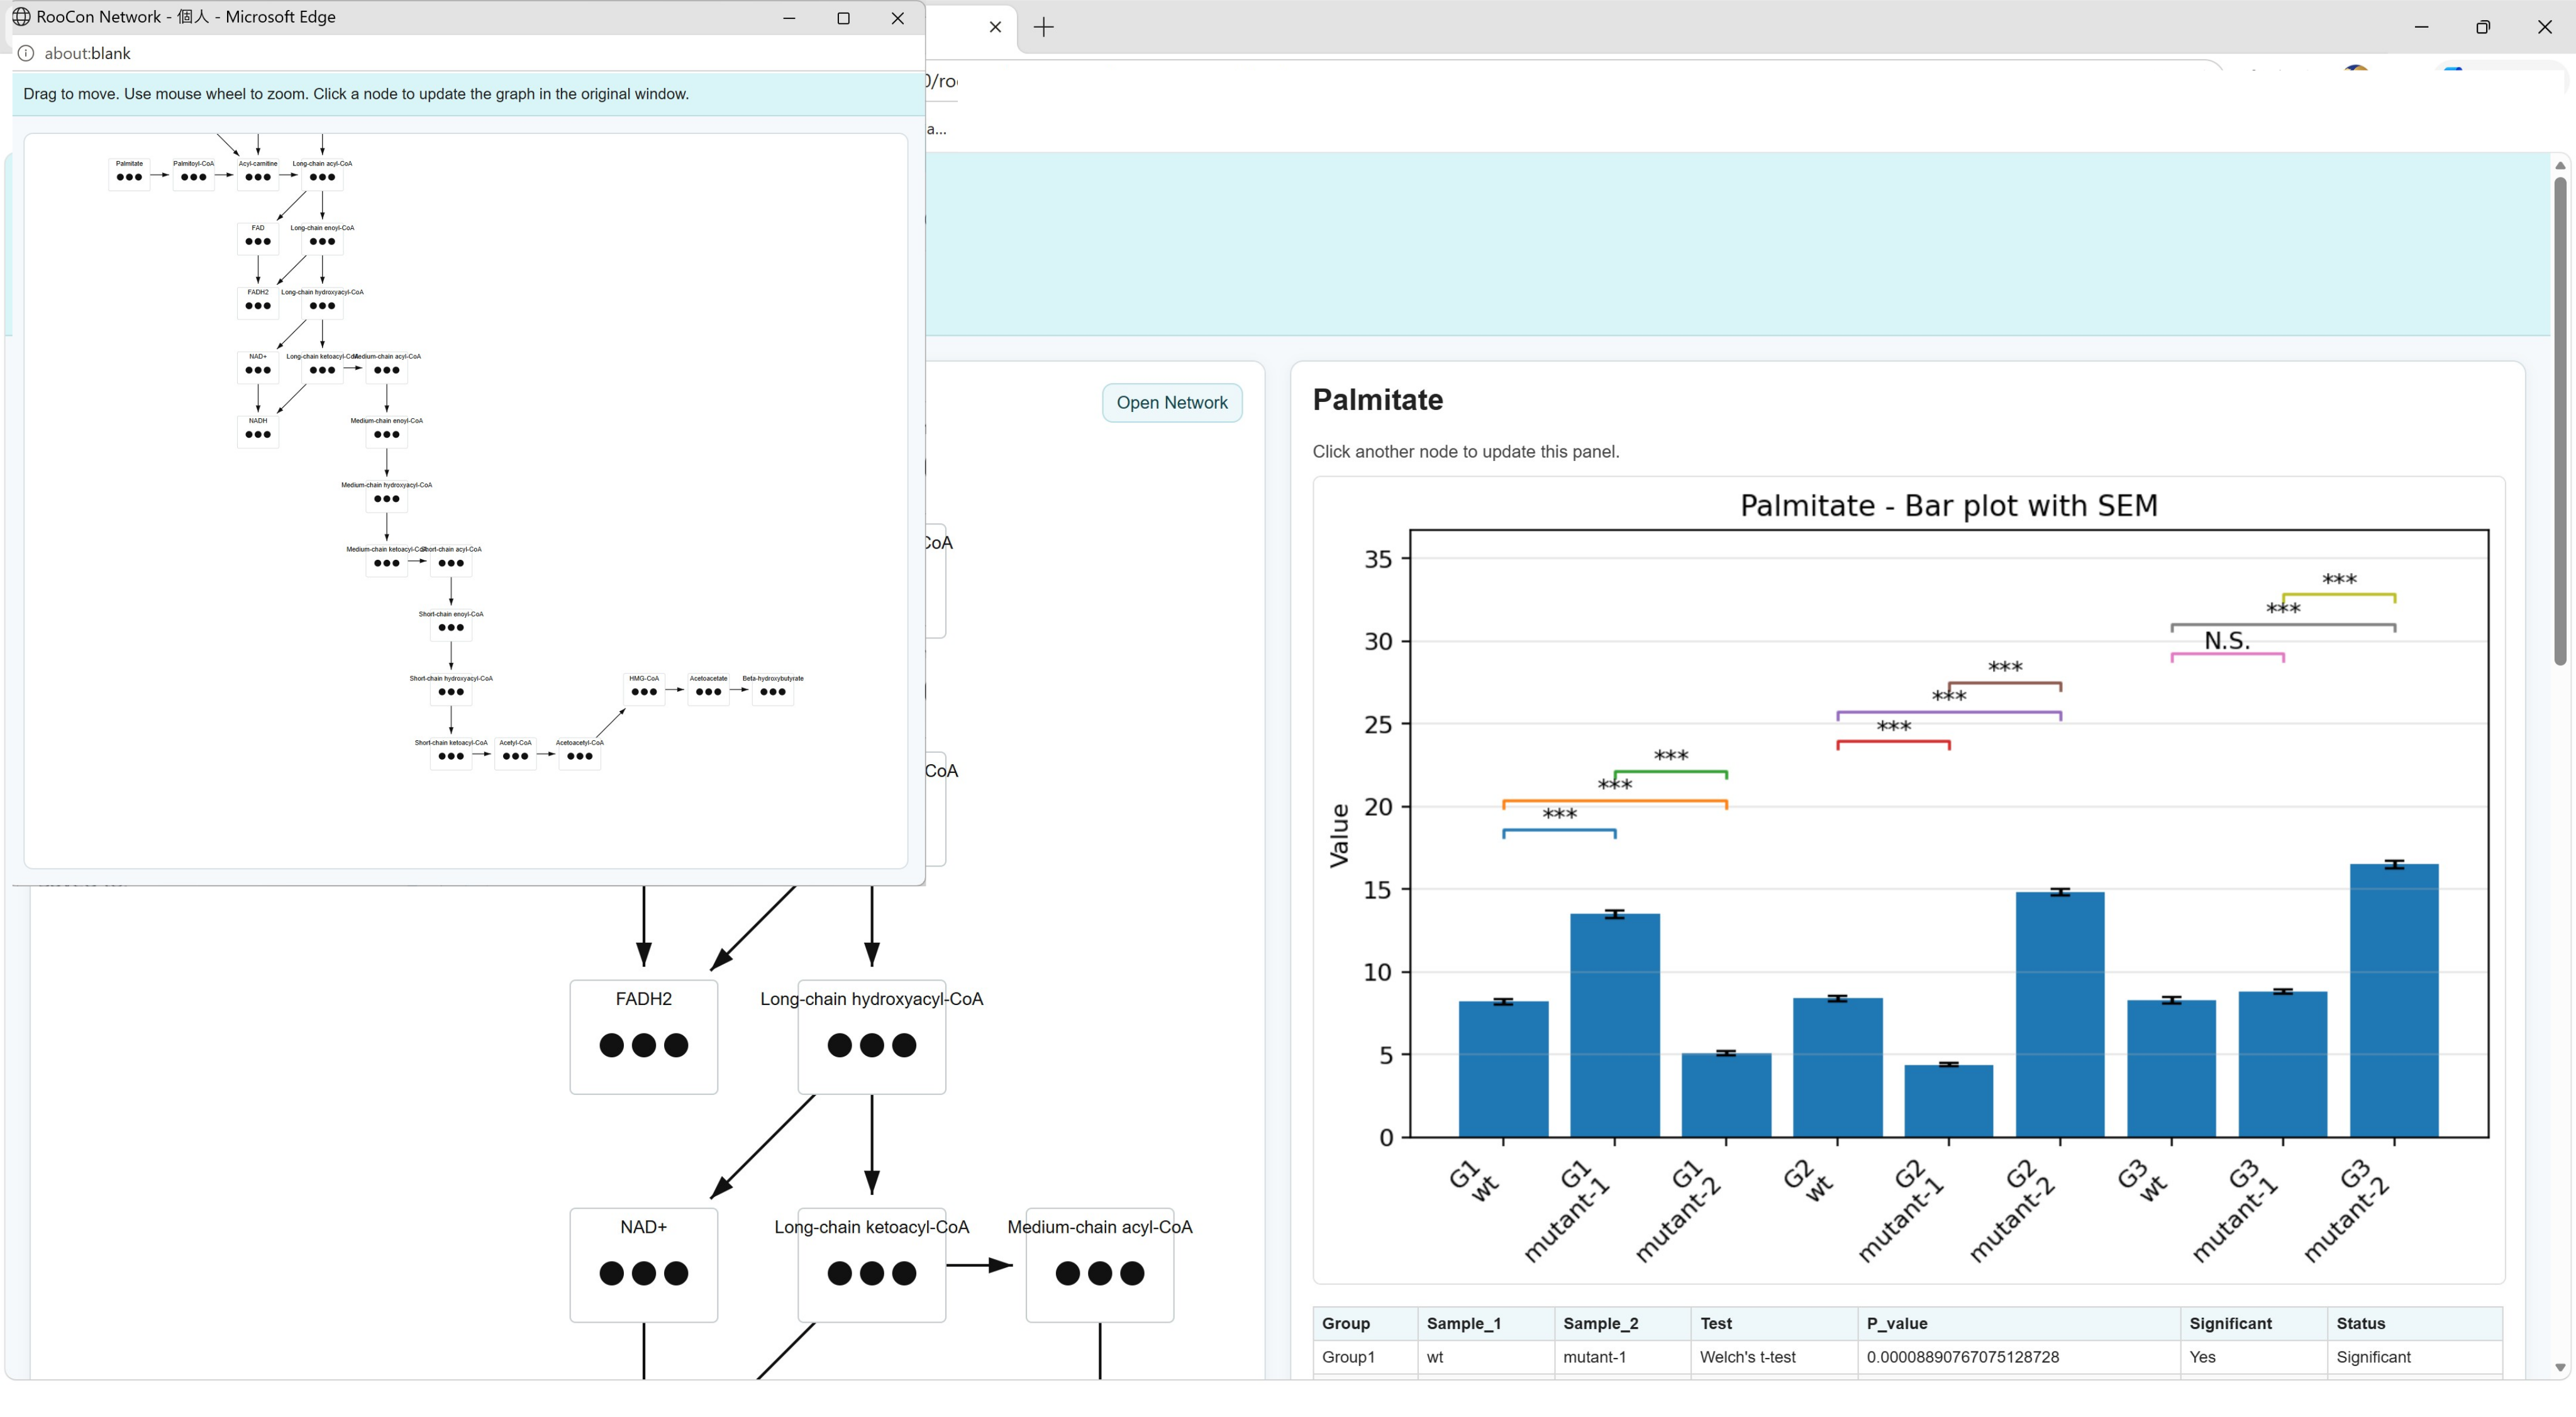
Overview
RooCon is a biological network analysis tool designed for researchers who want to interpret quantitative experimental data in the context of their own biological pathways and networks.
Users can define networks representing metabolic pathways, signaling pathways, gene-regulatory relationships, protein interactions, or other biological systems, and overlay experimental data directly onto those networks.
RooCon integrates statistical analysis, network visualization, interactive result exploration, HTML-based sharing, and LLM-ready export within a single local GUI workflow.
Key Advantages
1. Share interactive HTML results with anyone — no RooCon required
RooCon exports analysis results as a self-contained interactive HTML report. Collaborators, supervisors, and other researchers can explore the results directly in a standard web browser without installing RooCon.
2. Linked dual-window exploration of networks, plots, and statistics
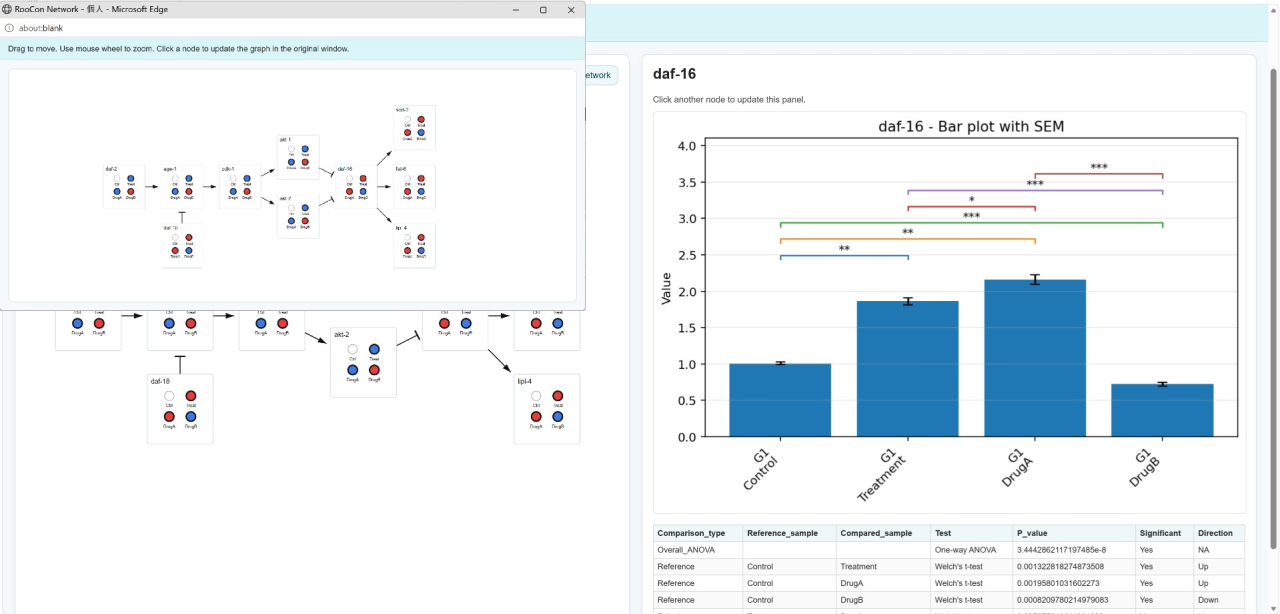
The biological network can be opened in a separate browser window while node-specific plots and statistical results remain visible in the main report. Selecting a node in the network automatically updates the corresponding graph and statistical results, enabling side-by-side exploration across two displays.
3. Convert analysis results into an LLM-ready format
RooCon can convert statistically analyzed results and network structure into a structured text format designed for use with large language models (LLMs). This supports downstream interpretation, summarization, comparison across conditions, and literature-assisted discussion.
Try an Interactive RooCon Report
Explore an actual interactive HTML report generated by RooCon. No RooCon installation is required. Select nodes, inspect plots and statistical results, and try the linked dual-window network view directly in your browser.
Download Demo HTMLAnalysis Workflow
-
Build a biological network
Create a user-defined pathway or network using the Pathway Editor. -
Import quantitative experimental data
Load measurements for genes, proteins, metabolites, signaling molecules, or other quantitative biological variables. -
Run statistical comparisons
Compare experimental groups or conditions using integrated statistical tests. -
Explore changes across the network
Visualize direction, statistical significance, and node-specific quantitative results. -
Share or extend the analysis
Export an interactive HTML report or convert the results to an LLM-ready format.
Analysis Modes
Group Comparison
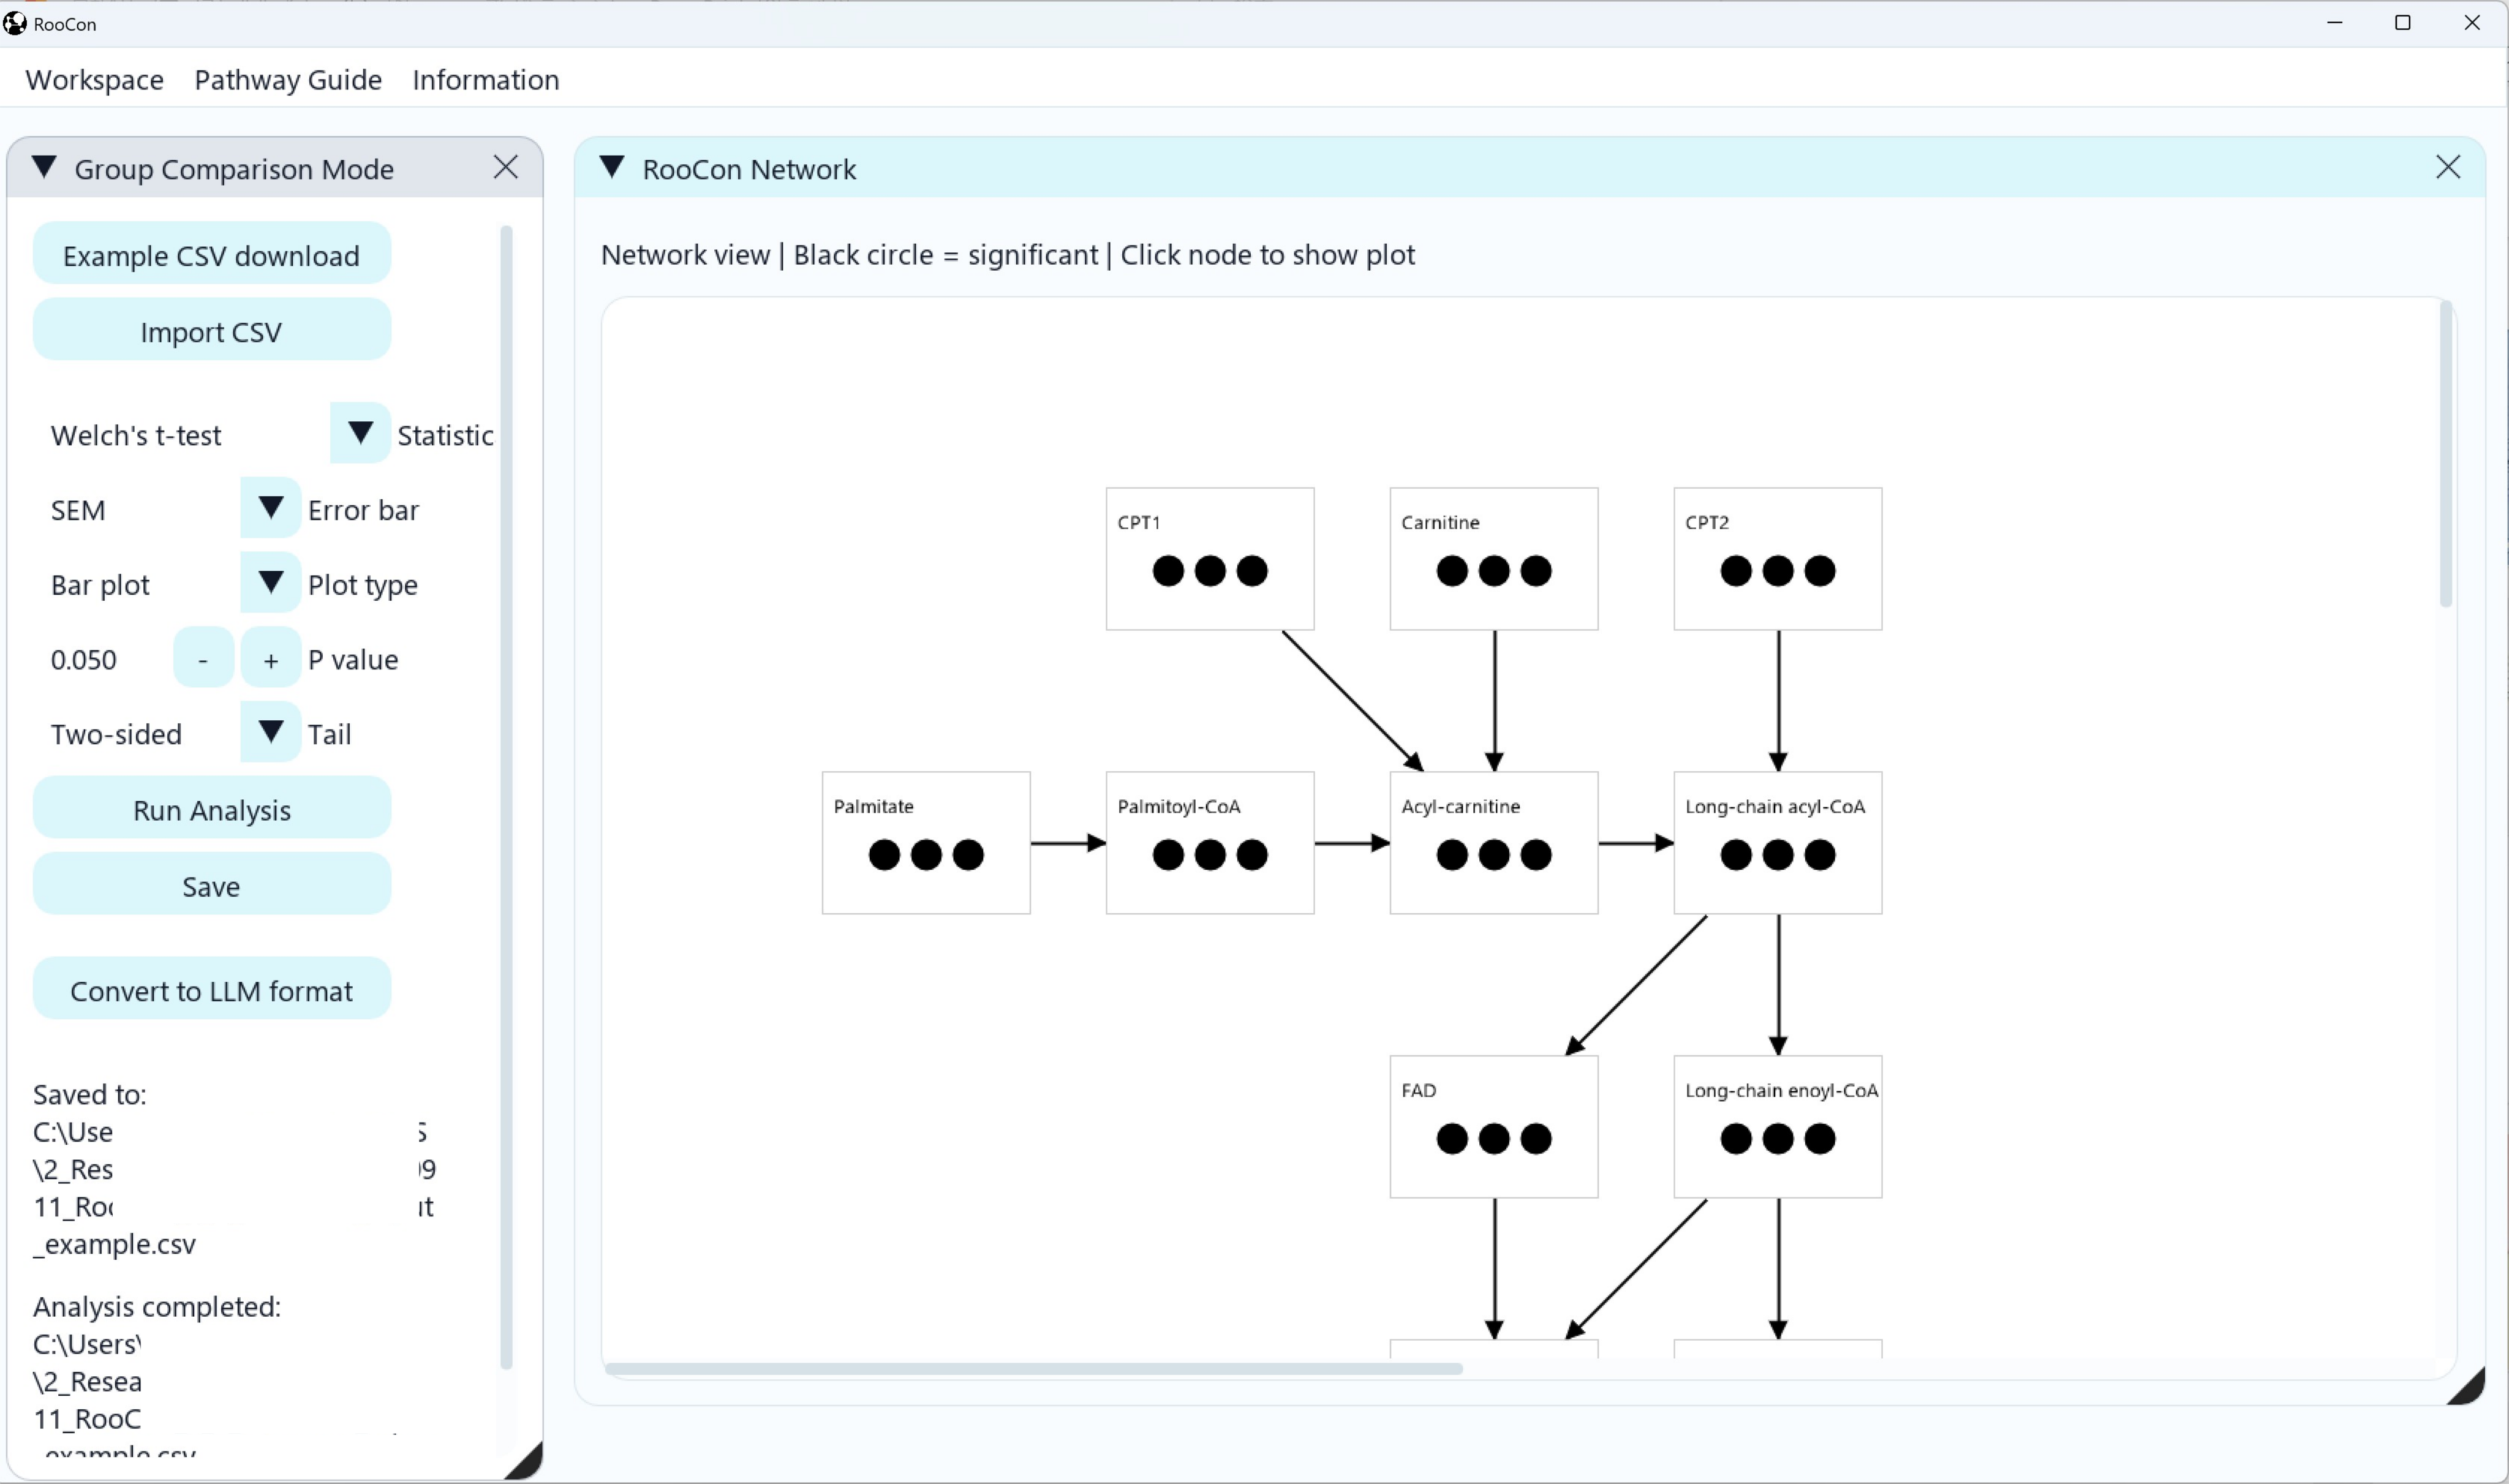
Compare multiple experimental groups and visualize group-dependent changes across a user-defined network. Node-specific plots and statistical comparisons can be inspected directly from the network.
Control Flow
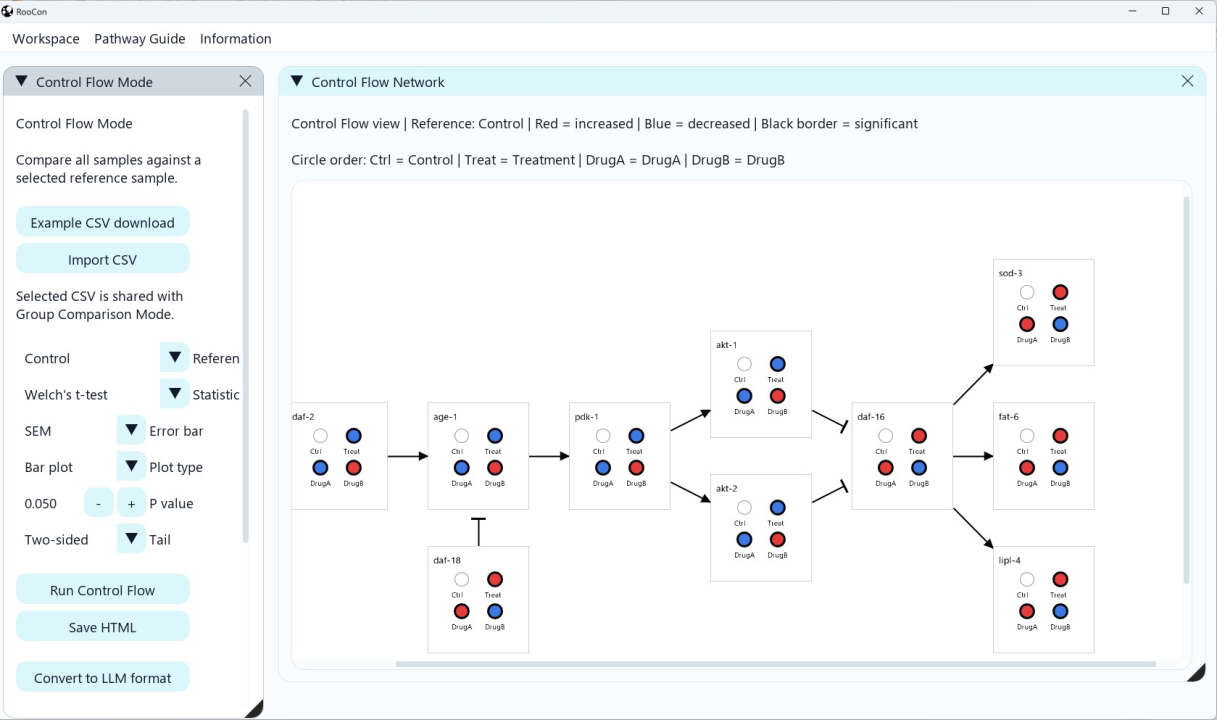
Visualize changes relative to a reference condition across connected biological nodes. RooCon displays the direction and statistical significance of changes while retaining the network structure for pathway-level interpretation.
Features
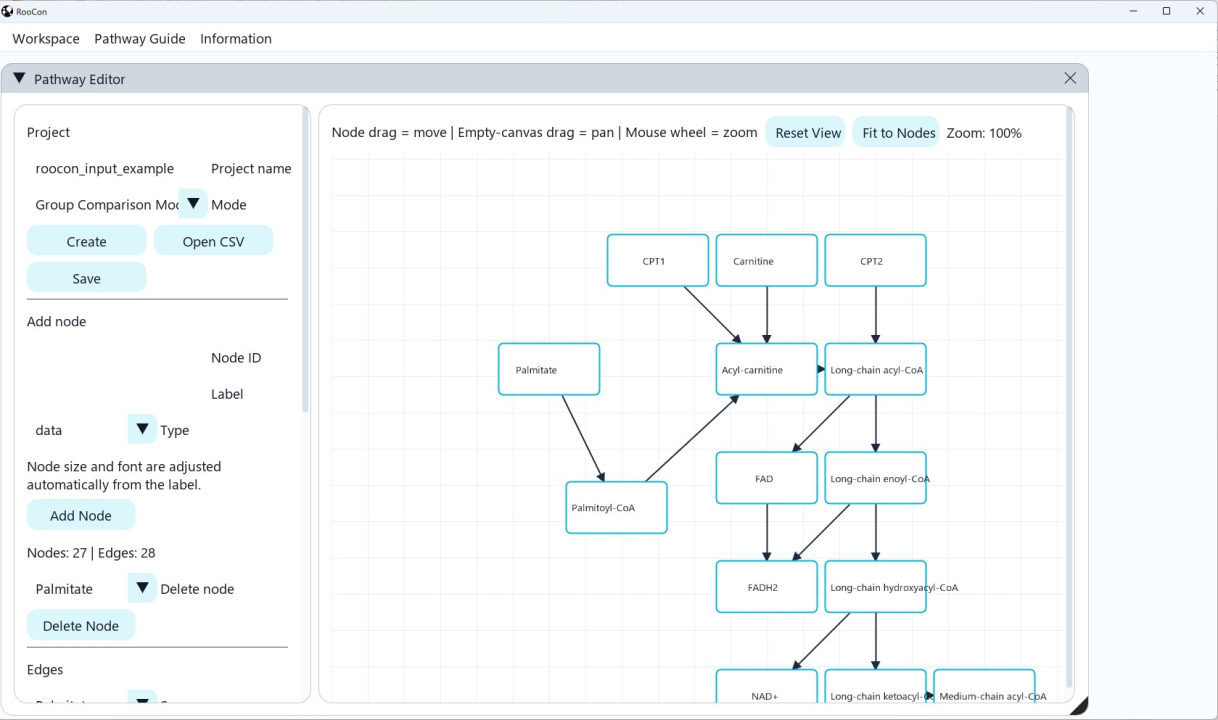
- Pathway Editor: Create and edit user-defined biological networks without coding.
- Group Comparison: Compare quantitative measurements among experimental groups.
- Control Flow: Visualize condition-dependent changes across connected biological nodes.
- Integrated statistics: Perform statistical comparisons directly within the RooCon workflow.
- Node-level visualization: Display bar plots or box plots together with statistical results.
- Interactive HTML export: Share self-contained browser-based analysis reports.
- Linked dual-window analysis: Explore the network and node-level results simultaneously.
- LLM-ready export: Convert analyzed results and network structure into structured text for LLM-assisted interpretation.
- Local analysis: Perform analysis on the user's own computer without requiring a remote analysis server.
Applications
- Metabolic pathways
- Signal transduction pathways
- Gene-regulatory networks
- Protein interaction networks
- Multi-omics datasets
- User-defined biological hypotheses and experimental models
Screenshots
Examples of RooCon network visualization, statistical analysis, Pathway Editor, and interactive HTML reports.
Case Studies
The University of Osaka
Mass Spectrometry Center, Graduate School of Science, The University of Osaka
RooCon was adopted for academic research use in 2026.
Pricing
- Academic license: 10,000 JPY (excluding tax)
- Standard license: 30,000 JPY (excluding tax)
Perpetual license.
One license is assigned to one PC.
Pricing is subject to change for future releases.
System Requirements
- Operating System: Windows 10 (64-bit) or later
- CPU: 64-bit processor
- Memory: 8 GB RAM recommended
- Display: Full HD recommended
- Web browser: Required for viewing interactive HTML reports
Python installation is not required for end users.
Performance may vary depending on network size and dataset size.
Contact
For product inquiries, evaluation, licensing, or technical questions:
Contact TILS
Developer and Seller
Torigoe Institute of Life Science, LLC